


Charted: Global CO2 Emissions by Income Group
From a historical perspective, the current demand for natural resources has surged to unprecedented levels and continues to escalate—for both essential needs like food, clothing, water, housing, infrastructure, and non-essential consumption in everyday life.
This surge has been accompanied by annual increases in CO₂ emissions. Consumption, however, differs radically depending on income.
In this graphic, we visualize global CO₂ emissions in 2019, broken down by income group. This data comes from the Emissions Inequality Calculator, created by the Stockholm Environment Institute.
Wealthier Families Contribute More to CO₂ Emissions
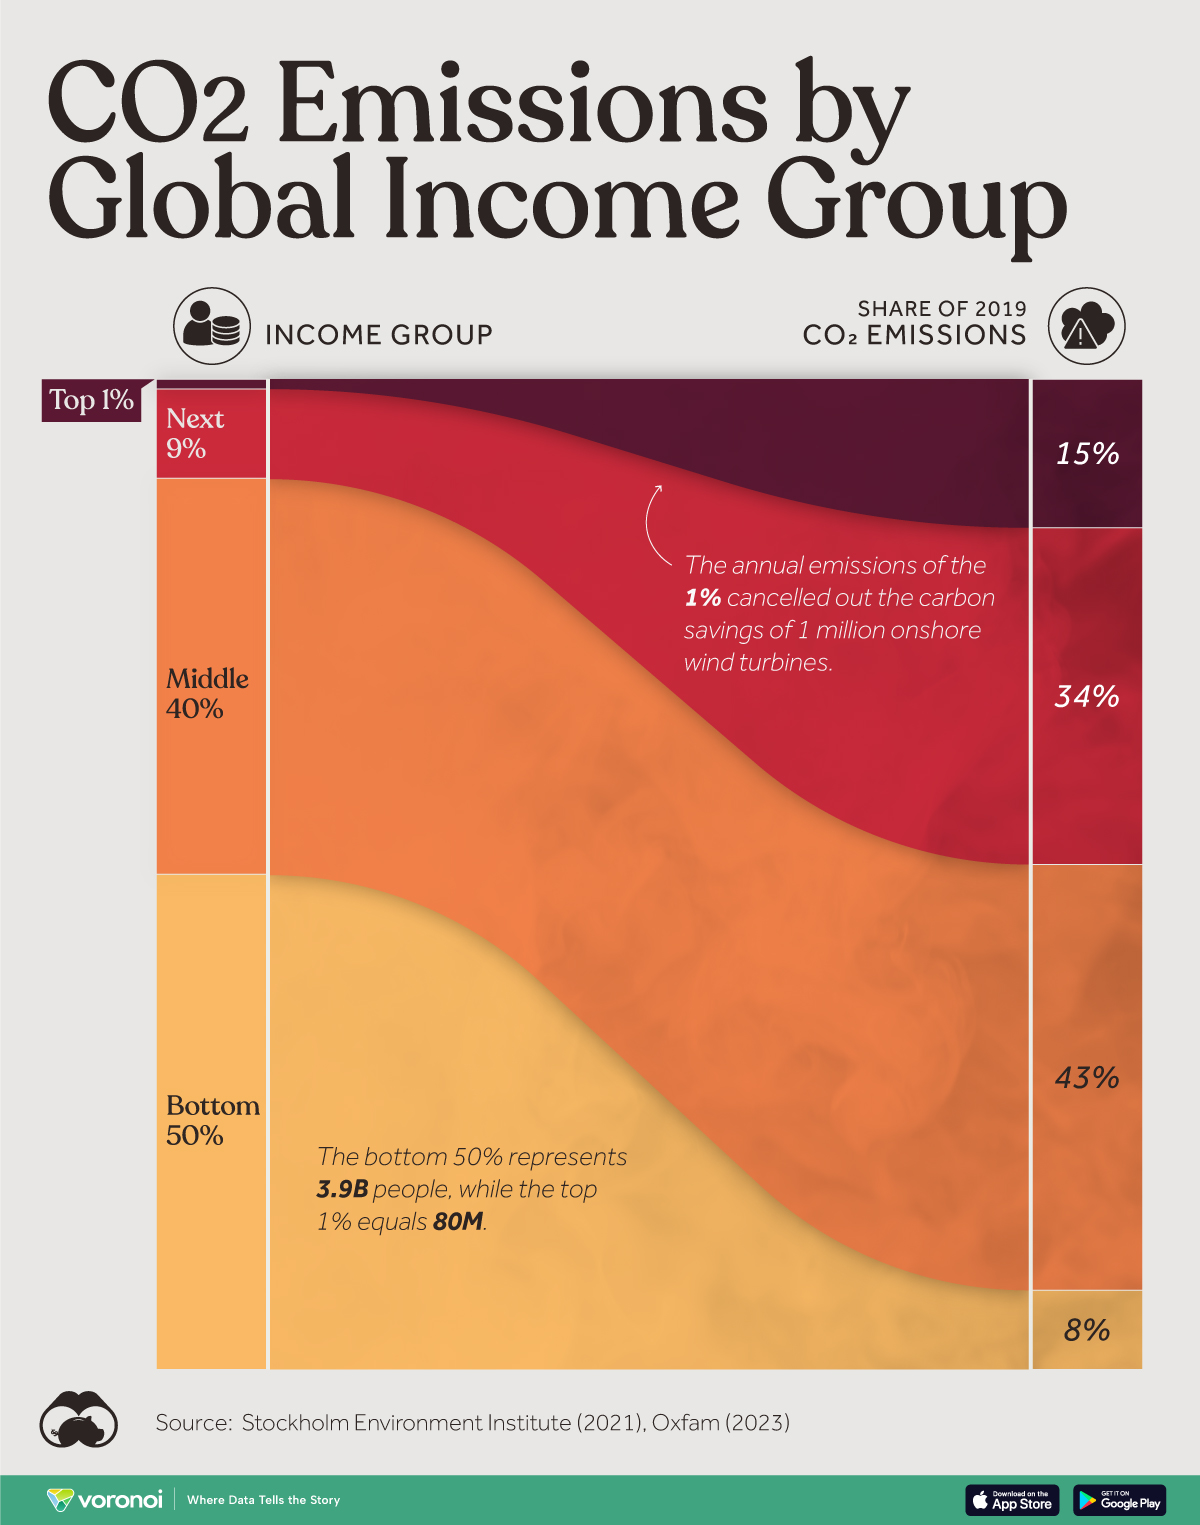
In 2019, the world’s richest 1% (with an average income of $310K) were responsible for 15% of global CO₂ emissions.
The annual emissions of the 1% in 2019 canceled out the carbon savings of 1 million onshore wind turbines. In contrast, the bottom 50% (with an average income of $2,000) were responsible for only 8% of CO₂ emissions.
Here is the breakdown of emissions by income group in 2019, with average income in 2011 purchasing power parity USD:
| Income Group | Average income (USD) | Share of CO₂ Emissions |
|---|---|---|
| Top 1% | $310K | 15% |
| Next 9% | $90K | 34% |
| Middle 40% | $16K | 43% |
| Bottom 50% | $2K | 8% |
The reason for such disparity lies in consumption. For example, fashion is one of the most demanded industries in the world’s high-income countries. According to the UN, the fashion industry produces between 2% to 8% of global carbon emissions.
Another major contributor is the transport sector, which is more prevalent in developed countries. Greenhouse gas emissions from the transport sector alone have more than doubled since 1970, with around 80% of this increase coming from road vehicles.
Higher-income families also spend more on food, contributing to CO₂ emissions. The production, transportation, and handling of food generates significant CO₂ emissions. In addition, when food ends up in landfills, it also generates methane.
According to the U.S. Environmental Protection Agency, each year, U.S. food loss and waste embodies 170 million metric tons of carbon dioxide equivalent GHG emissions (excluding landfill emissions)—equal to the annual CO₂ emissions of 42 coal-fired power plants.
Related Info:
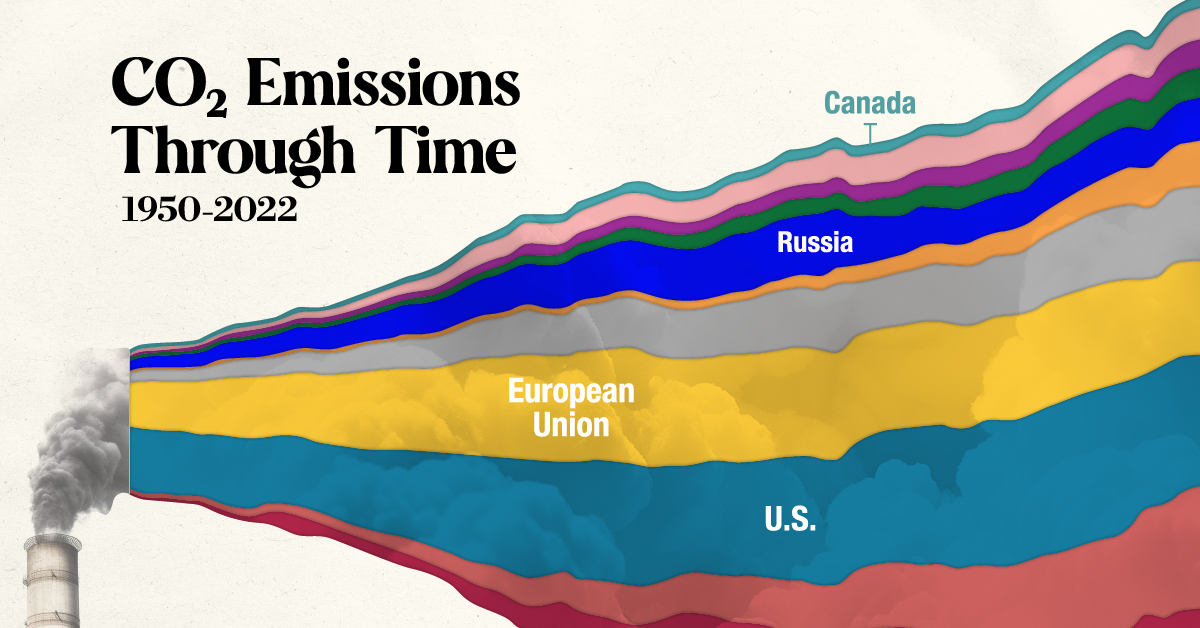
Visualized: Global CO2 Emissions Through Time (1950–2022)
In this streamgraph, we break down global CO2 emissions between 1950 and 2022 using data from Berkeley Earth and Global Carbon Project.